KPIs: From Strategy to scorecard
In many ways, KPIs act as the cornerstone of the Kanbrick Business System. They weave together strategic logic, financial outcomes, and team alignment by:
- Translating strategy into clear outcomes – separating true signal from day-to-day noise.
- Linking financial targets to action plans – tying budget goals to underlying operating levers and to the initiatives that achieve them.
- Creating a shared scoreboard – so every team and individual knows what matters and who owns it.
They can also profoundly shape culture. Because KPIs focus on outcomes rather than tasks, they quietly re-wire how people think about their jobs. When every team can see – on one page – whether they’re winning or slipping, three cultural shifts take hold:

Accountability replaces ambiguity.
When a metric turns red, there’s no confusion about who owns the next move – the name is right beside the number. A red metric is simply a shared signal: “Something’s off-let’s dig in and fix it.” Clear ownership drives action, while transparency lets everyone see progress in real time.

Empowerment replaces compliance.
Clear targets tell people what must improve but not how. That freedom invites frontline experimentation – new process tweaks, technology pilots, customer-feedback loops – because anyone can see immediately whether a change moves the needle.

Learning replaces luck.
Consistent measurement builds an institutional memory. Teams notice patterns (“Every time uptime tops 96%, warranty calls drop”), capture the lesson, and raise the bar. Over time, the organization behaves less like a collection of heroic fire-fighters and more like a disciplined learning machine.
In short, KPIs don’t just report the culture; they create it – one transparent metric, one clear target, and one owned outcome at a time.
There is often confusion around KPIs, relative to other key data like reporting or analytics. Each plays a distinct role in managing a business – here’s how we like to think of them:
Type
Reporting
Analytics
KPIs
Distinction
Any regularly tracked data, providing awareness of business performance
Ad-hoc deep dives to answer specific questions or solve targeted problems
Select subset of critical financial & non-financial metrics closely tied to strategy, assigned clear accountability
Example
Monthly
sales report
Customer
churn analysis
Customer
retention %
While reporting and analytics provide valuable context, KPIs stand out due to their strategic importance. They reflect your most critical business drivers, align clearly to individual and team accountability, and explicitly link day-to-day activities to broader strategic and financial objectives.
In our work with midsize businesses, we find many teams struggle to unlock the full potential of KPIs, often running into five common pitfalls:
Pitfall
Description
Example
Over-reliance on
financial metrics
Teams monitor the scoreboard (revenue, margin) closely, spending less time on the on-field plays (customer retention, regional sales productivity, NPS) that actually move them.
Revenue gets a weekly review; while customer retention % or NPS don’t make the agenda or aren’t tracked at all.
Reporting
overload
Excessive data and reporting drowns out important signals, reducing clarity around what really matters.
A 20-page quarterly “Voice of Customer” deck with 32 survey questions buries the one metric that should drive action.
Missing or
misaligned KPIs
KPIs don’t mirror the strategy, or key priorities have none at all.
“We’re customer-first,” yet only complaint tickets are tracked; no metric captures proactive satisfaction.
Lack of KPI
targets
Numbers exist, but no one knows what “good” looks like – so nothing moves.
Customer Satisfaction is reported at 78, but there’s no goal, trendline, or plan to reach 85.
Lack of clear KPI
accountability
KPIs aren’t clearly assigned to individuals or linked to incentives, causing accountability to slip.
Customer satisfaction is “everyone’s job,” so no single leader drives improvements or ties it to incentives.
So, how do you avoid these pitfalls and actually make KPIs work?
At Kanbrick, we take a step-by-step process to KPIs across three distinct steps:

Step 1
Pick the right
KPIs
Choose metrics that directly drive your strategic and financial goals

Step 2
Set concrete
targets:
Make KPIs actionable by connecting them directly to your financial plan

Step 3
Assign clear
ownership:
Create accountability and empower teams to proactively solve problems
THE ART OF SELECTING THE RIGHT KPIs
Selecting the right KPIs is more art than science. In his excellent book The Outsiders, Will Thorndike highlights how exceptional CEOs often obsess over one or two specific, non-obvious metrics they believed would fundamentally drive their company’s long-term success. For example, John Malone of TCI prioritized subscriber growth above all else, understanding intuitively that expanding the customer base was the essential driver behind broader strategic and financial outcomes. This intense clarity allowed Malone to confidently align decisions and resources, knowing that improving this single metric would ensure the overall strategy succeeded.
Great KPIs look upstream. They pull attention away from end-of-month scoreboards and onto the handful of levers – customer retention, labor hours per unit, turnaround time – that teams can actually move. The list should hit a Goldilocks sweet spot: wide enough to cover every critical driver, but tight enough that every employee can point to their number. Most importantly, each KPI must echo your unique strategy, so daily actions snap cleanly to long-term wins.
Kanbrick’s “Goldilocks” rules for selecting KPIs:

Less is more:
Start with ~15-20 company KPIs to maintain clarity and focus, with no more than five per functional leader.

Outcomes over activities:
Track the result you want (e.g., “on-time installs”) instead of the inputs (e.g., “number of site visits).” Outcome metrics encourage teams to think creatively and innovate rather than simply finish tasks.

Balance leading and lagging indicators:
Pair metrics confirming results (lagging) with metrics signaling future performance (leading) to proactively influence outcomes.

Quantitative and qualitative [1]:
Hard numbers explain what happened; sentiment explains why. Use lightweight tools – pulse surveys, structured call notes, quick NPS polls – to gather qualitative data you can refresh regularly.
- Jeff Bezos from an interview with Led Friedman: “I have a saying which is: When the data and the anecdotes disagree, the anecdotes are usually right. It’s usually not that the data is being miscollected. It’s usually that you’re not measuring the right thing. If you have a bunch of customers complaining about something, and at the same time your metrics look like they shouldn’t be complaining, you should doubt the metrics.”
To make KPI selection easier on ourselves,
we organize them into five categories:
Below, you’ll find a straightforward playbook for each category, complete with examples, so you can zero in on what matters most and keep every team accountable to the same strategic priorities.
GROWTH KPIs
Choosing the right revenue drivers is often the hardest part of building a scorecard.
There are countless ways to segment and analyze topline performance by customer segments, channels, products, pricing, and more. To cut through this complexity, we use a simple but powerful tool called a driver tree: a one-page map that breaks total revenue into a few first-principle components. The tree shows, at a glance, which branches actually move the top line and which are just interesting trivia.
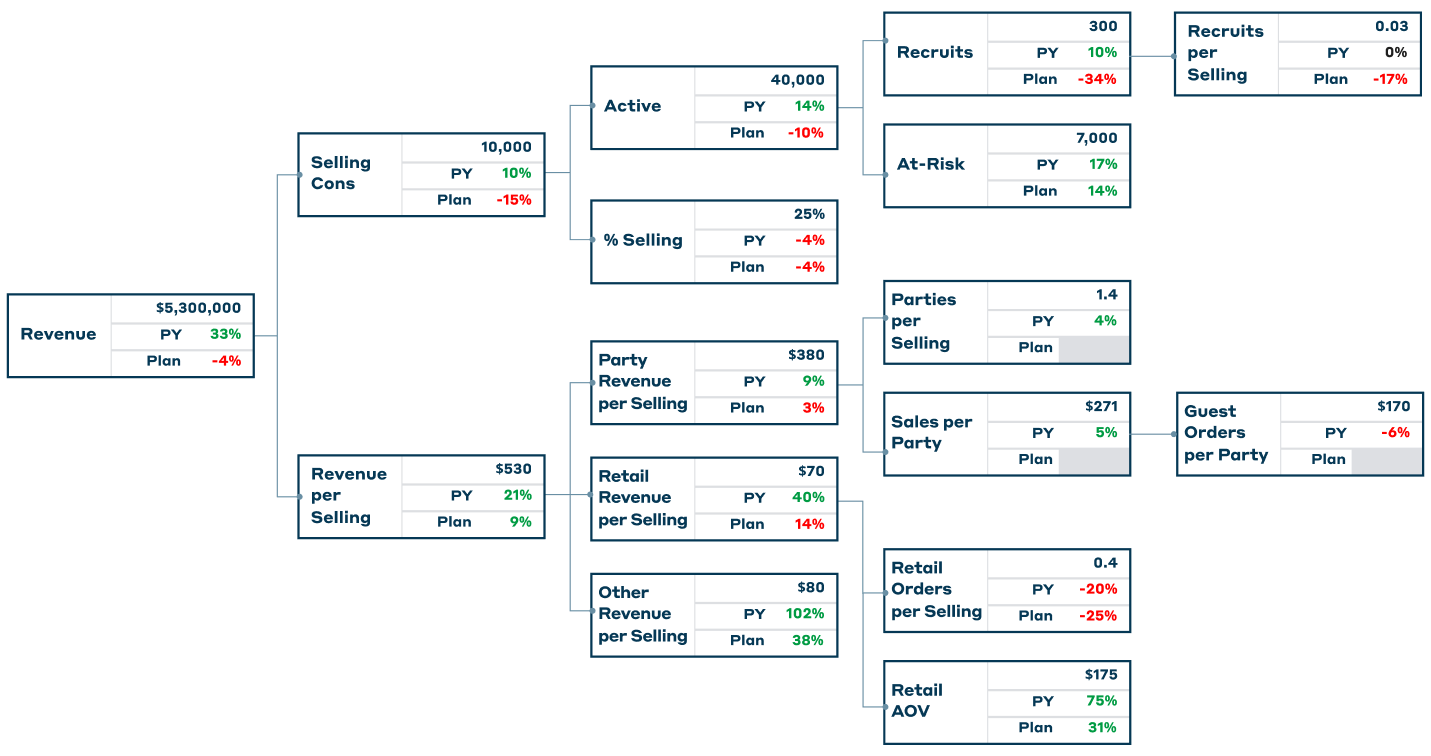
For example, consider the attached driver tree visual. At a glance, the chart clearly shows why revenue missed expectations: it wasn’t due to productivity (revenue per selling consultant was up), but instead resulted from a shortfall in active selling consultants. Digging deeper reveals this shortfall stems from two distinct issues—too few consultants overall (“Active”) and fewer active sellers (“% Selling”).
The driver tree helps teams quickly pinpoint actionable areas of focus. Recruiting can add new consultants, training teams can increase seller activation, and marketing can enhance productivity. By matching these clear components to specific teams and roles, driver trees transform vague performance issues into actionable problems, dramatically accelerating problem-solving speed.
With the driver tree in hand, picking KPIs gets easier.
Prioritize components based on two criteria:

Prioritizing KPIs that meet both tests – and pass the Goldilocks Rules check – ensures your metrics are strategically aligned and directly actionable.
Below is a structured table outlining common growth-driver categories that can be used to build various driver trees and example KPIs tailored for both B2B and B2C organizations:
With the driver tree in hand, picking KPIs gets easier.
Prioritize components based on two criteria:
Prioritizing KPIs that meet both tests – and pass the Goldilocks Rules check – ensures your metrics are strategically aligned and directly actionable.
Below is a structured table outlining common growth-driver categories that can be used to build various driver trees and example KPIs tailored for both B2B and B2C organizations:
Category
What It Explains
Example B2B KPIs
Example B2C KPIs
Market /
Customer Mix
Which customer or market segments are driving (or dragging) revenue growth.
- Revenue by customer industry, size, or other segments
- Share-of-wallet in top accounts
- Revenue by demographic or region
- Market-share % in target segment
Channel &
Product Mix
Where revenue comes from (channels) and which products/services are selling.
- Revenue by channel (direct, dealer, etc.)
- Product-line / SKU mix
- Revenue from new products
- Revenue by channel (e-com, retail, affiliate)
- Category / SKU mix
Price &
Volume Mix
The core revenue equation-are we winning on price, on volume, or both?
- Price per unit (controlled for mix)
- Units shipped / volume YoY
- Average order value
- Units sold / transactions
Price
Realization
Whether we’re actually capturing the value we aim for on each sale or deal.
- Price realization vs. list
- Average discount %
- Deal margin
- Realized selling price vs. list
- Promo mix vs. margin impact
Top-of-Funnel
Demand
Raw inbound interest that fuels future sales.
- Marketing-qualified leads
- Demo / quote requests
- Unique site visits / app installs
- Email sign-ups
New
Customer
Acquisition
How effectively we convert prospects into first-time buyers.
- New-logo wins
- Lead-to-win rate
- First-time buyer count
- Add-to-cart → purchase conversion %
Existing
Customer
Retention &
Expansion
How well we keep-and grow-the customers we already have.
- Net Revenue Retention (NRR)
- Expansion ARR
- Churn rate
- Repeat-purchase rate
- Subscription renewal % / lifetime value
Pick only the KPIs that match your driver-tree “hot spots”, assign clear owners, and track them alongside financial outcomes. Done right, growth KPIs shift the conversation from “What happened?” to “Which lever do we pull next?”
EFFICIENCY KPIs
Efficiency KPIs shift the mindset from managing costs to getting the most out of your spend.
Costs are often managed solely through the budgeting process, tracking how spend compares to the planned amounts.
Efficiency KPIs go a step further: they clarify the relationship between your spending and the value delivered, helping teams pinpoint exactly how to deliver the same or greater value at lower cost over time. This shifts accountability from simply “staying on budget” to actively improving efficiency.
Identifying the right efficiency KPIs starts by understanding the underlying drivers behind each major spend category (notice every efficiency KPI has a “per”). Costs shouldn’t always be measured purely against revenue. For example, many HR expenses should scale with headcount, not top-line growth. Clearly linking each cost bucket to its correct operational driver ensures you’re tracking the true efficiency of your operations.
To build your efficiency KPI scorecard, follow this straightforward approach:
1
2
3
4
This structure shifts teams from watching the budget to actively improving efficiency – unlocking sustainable, profitable growth.
Bucket
Sub-Area
Why It Matters
Representative KPIs
COGS
Efficiency
Labor &
Production
Labor hours, uptime,
and defect costs hit
gross margin first.
- Labor productivity (e.g., units per paid hour vs. standard)
- Overall equipment effectiveness (OEE) %
- % Right-first time
Materials &
Procurement
Sourcing price, yield,
and waste drive both
margin & cash
- Material cost % of revenue
- Purchase-price variance
- Scrap %
- Supplier OTIF
Logistics &
Distribution
Moving, storing,
delivering product can
quietly erode profit.
- Freight $/unit
- Outbound cost % of sales
- Perfect-order / OTIF rate
Commercial
Efficiency
Sales Productivity
Output per sales resource—how leanly demand turns into dollars.
- Revenue per sales FTE
- Win rate %
- Sales cost % revenue
Marketing
Efficiency
Dollars required to fill
the funnel.
- Customer acquisition cost (CAC)
- Cost-per-lead (CPL)
- Marketing cost % of revenue
Customer
Service Cost
Post-sale spend to
retain customers and
protect LTV.
- Cost per ticket
- First-contact resolution %
- Support cost % of revenue
G&A
Efficiency
IT &
Systems
Tech spend should scale
slower than revenue.
- IT spend % of revenue
- SaaS $/user
- Unplanned downtime hours
Corporate
Overhead
“Keep-the-lights-on”
costs must stay lean
as you grow.
- G&A spend % of revenue
- Finance cost per invoice
- HR cost per FTE
Capital
Efficiency
Working Capital
Faster cash cycle frees funds for growth.
- Inventory turns / DOH
- DSO
- DPO
- Cash-conversion cycle
Capex &
Return on
Capital
Long-term investments
must earn their keep.
- ROIC
- Capex % of revenue
- Payback period / equipment yield %
- EBITDA – maintenance capex %
Using this structured, driver-based approach will help your organization move beyond cost management alone, driving clear accountability for improving efficiency – delivering more value at lower cost over time.
CUSTOMER VALUE KPIs
Financial metrics alone can leave blind spots about how customers truly experience your business.
Customer Success KPIs provide essential clarity, highlighting whether your operational performance aligns directly with the promises you make to customers – whether that’s exceptional quality, fast service, strong reliability, or unbeatable price-for-value.
By selecting KPIs that measure these aspects directly from your customers’ viewpoint, you ensure you’re genuinely delivering on your strategic value proposition, safeguarding long-term loyalty and trust even as you achieve short-term financial outcomes.
To choose the right customer-focused KPIs, follow these practical guidelines:
1
2
3
The table below provides practical KPIs to measure the major dimensions of customer success:
Category
Why It Matters
Representative KPIs
Satisfaction
& Advocacy
Indicates customer happiness, retention, and willingness to recommend.
- NPS
- CSAT
- Post-interaction surveys
Brand Trust
& Perception
Reflects reputation influencing consideration and customer loyalty.
- Brand-awareness index
- Social sentiment
Quality
& Accuracy
Ensures consistent fulfillment of customer expectations.
- Perfect Order %
- Return/defect rate
- Warranty claims
Availability
& Reliability
Confirms your product or service is consistently available and dependable.
- In-stock %
- Service uptime %
- Mean time between failures (MTBF)
Convenience
& Speed
How easily and quickly customers get the value you promise.
- On-time delivery %
- Turnaround time
- First-response time
Issue Resolution
& Recovery
Effectiveness in solving issues and converting detractors to promoters.
- Time-to-resolution
- Escalation rate
- Post-issue NPS
Value-for-Money /
Price Competitiveness
Ensures customers consistently feel they’re getting good value compared to competitors.
- Price index vs. competitors
- Value-for-money survey score
- Discount frequency vs. peers
Selecting and regularly monitoring these KPIs alongside your financial and operational metrics ensures your teams stay focused on genuinely delivering your strategic promises to customers, securing long-term satisfaction and sustainable competitive advantage.
TEAM & CULTURE KPIs
Team & Culture KPIs translate the idea that “businesses are built by people, not spreadsheets” into measurable actions.
These metrics ensure you’re cultivating a motivated, capable, and engaged team – not only critical for achieving short-term financial targets, but also for driving innovation, productivity, and long-term sustainable growth.
Beyond business outcomes, we believe great businesses are built by people who love what they do and can become their best selves at work. Our goal is to create an environment where everyone finds purpose, grows into their personal and professional full potential, and thrives along the way. Managing to that outcome requires the same rigor in measurement as any other.
TO CHOOSE THE RIGHT TEAM & CULTURE KPIs:


The table below provides practical KPIs to measure the major dimensions of customer success:
Category
Why It Matters
Representative KPIs
Engagement
& Satisfaction
Morale and effort drive productivity, innovation, and retention.
- Employee CSAT
- eNPS
- Pulse-survey engagement score
Retention
& Turnover
High churn erodes culture, knowledge, and customer continuity.
- Voluntary turnover %
- Top talent retention %
- First-year attrition %
Talent Acquisition &
Onboarding
Speed and quality of hiring determine how quickly you close capability gaps.
- Time-to-hire
- Offer-acceptance rate
- New-hire 90-day retention
Development
& Performance
Growth opportunities and clear expectations keep talent engaged and prepared.
- % with active development plans
- Training hours per FTE
- Internal-promotion ratio
Safety
& Well-Being
Protecting employees ensures accountability and reduces downtime.
- Recordable-incident rate (TRIR)
- Lost-time injury frequency (LTIFR)
- Near-miss reports per FTE
Business System
(KBS) Maturity
At Kanbrick, we believe building stronger management practices is fundamental to unlocking long-term business value.
- KBS Maturity self-assessment score [2]
- For more detail on how we measure KBS Maturity, you can reach out to Sloan@Kanbrick.com
Consistently tracking and acting on these KPIs anchors your strategic goals in a healthy, engaged, and high-performing team, building a robust foundation for sustainable growth.
RISK MANAGEMENT KPIs
Growth means very little if a single misstep can halt operations, trigger fines, or erode trust overnight.
Risk-management KPIs give your leadership team an early-warning dashboard, flagging exposures before they become costly problems and reinforcing a culture of integrity and accountability.
Choosing the right risk KPIs
1
2
3
Category
What to Watch
Simple KPIs to Track
Regulatory
&
Statutory Compliance
Meet filing deadlines and pass external audits.
- On-time filings %
- External-audit findings (count / severity)
Financial
Controls & Integrity
Keep the books clean and cash secure.
- Key-control test pass %
- 100% accurate & on-time month-end %
IT & Cybersecurity
Prevent breaches, protect data, and keep critical systems running.
- Critical-patch compliance %
- Reportable security incidents (count)
- Critical-system downtime (hrs)
Pick the few KPIs most relevant to your industry and risk profile, review them alongside financial and operating metrics, and you’ll catch small issues before they become headlines.
Selecting KPIs is less about finding a perfect formula and more about disciplined focus. Choose a handful of measures that map directly to your strategy and the levers that truly move performance.
At Kanbrick, we know we’re done when we can fit those metrics onto a concise scorecard that sits beside the financials, is easy to share, and is reviewed regularly by the leadership team. The goal isn’t more reporting-it’s cutting through noise and giving everyone a clear line of sight to what matters most. With the right KPIs in place, your team can spend less time guessing and more time driving the outcomes that fuel long-term success.
KPI Target-Setting
Good KPI targets turn numbers into clear expectations.
As a CEO, you already spend significant effort setting precise financial targets like revenue or profit. It’s equally critical-and often even more impactful to apply the same rigor and discipline when defining operational KPI targets. The process of thoughtfully setting these targets clarifies expectations, strengthens accountability, and transforms your KPIs into powerful tools that drive meaningful strategic and operational improvements.
However, setting KPI targets can feel harder than setting traditional financial goals. Unlike financial metrics, operational and customer-related KPIs often lack clear historical benchmarks or direct ties to financial forecasts, making targets seem subjective or difficult to define clearly. That’s normal and common among midsize businesses.
we simplify this complexity by sorting KPIs into three clear buckets:
Bucket
Description & Examples
How to Set the Target
Directly
Financial
KPIs explicitly connected to your financial plan, such as revenue per customer or EBITDA margin. These flow naturally from your budget.
Directly lift targets from your annual budget or quarterly forecasts, ensuring full alignment and clarity.
Operational
Drivers
KPIs closely tied (but not explicitly financial), like labor utilization, production yield, or inventory turnover. Improving these metrics directly influences financial results.
Perform a quick “what you need to believe” analysis: identify exactly how much operational improvement you need to hit your financial goals, and set targets accordingly.
Everything
Else
Important metrics without clear historical or financial benchmarks, including customer satisfaction, employee engagement, or safety metrics. These are crucial but harder to pin down.
Use a combination of:
- Historical trends to find realistic incremental improvements.
Industry benchmarks Internal benchmarks (aim halfway to top-quartile performance annually). - Wright’s Law, which suggests consistent incremental operational gains (e.g., best in class lean process work drives 1–2% improvement per quarter) from learning and efficiency improvements.
Practical Tips for Getting Started

Start now, refine later.
Don’t hold out for perfect data – initial targets drive improvement faster than waiting for perfection.
Publish KPIs & targets alongside your budget.
Ensures teams see a single, unified set of annual objectives.
Review and iterate.
Data and insights improve over time, making your targets increasingly
precise and relevant.
Setting clear KPI targets – even if imperfect at first – is essential. The discipline of defining targets is what truly shifts behavior and performance across your business.
Cascading KPI Ownership
Metrics matter when every number has a name.
Clear ownership is what shifts KPIs from being numbers on a dashboard to actionable responsibilities. As a CEO, embedding KPI ownership across your organization is one of the most critical steps toward real accountability and improved results. But this isn’t a one-time exercise – it’s a journey, with clear milestones along the way.
Here’s how we typically see KPI ownership unfold at midsize businesses:
When
Who
What It Looks Like
Year 1
Executive Team
Assign top-level KPIs explicitly to individual execs – not just the CEO. Clearly list their initials beside each metric on the company scorecard.
Year 2
Next-Level Leaders
Executives cascade their KPIs to direct reports, connecting overall goals to each team’s daily responsibilities. For example, CFO owns gross margin % → VP Ops owns direct labor % → Plant Manager owns labor utilization. Or in sales, CRO owns revenue → Sales Director owns pipeline health → Sales Rep owns activity targets.
Year 3+
Frontline Teams
KPI ownership becomes ingrained, guiding daily conversations and problem-solving at every level. Metrics become part of regular meetings and improvement huddles.
Quick Tips for Effective Ownership:
Clear ownership transforms how your teams think and act-empowering them to tackle challenges proactively, innovate solutions, and consistently deliver meaningful results.
Wrapping It All Up

Choose the handful that truly move your strategy (Growth, Efficiency, Customer Value, Team & Culture, Risk Management)

Set clear, believable targets that stretch but don’t break your teams

Assign one name to every number and keep those numbers visible week-in, week-out
…you give your organization a common language for winning.
Remember, this is a living system, not a one-time project. Your scorecard should evolve as the business evolves: retire metrics that have served their purpose, add new ones as priorities shift, and raise the bar as performance improves. Celebrate the greens, learn from the reds, and keep the conversation focused on actions – not just analysis.
The next step is simple: schedule your first leadership review with a draft scorecard in hand. Ask three questions:
Does every metric on this page matter?
Is every target clear and credible?
Does every metric have an owner who feels responsible?
If the answers are “YES,” you’re on your way.
If not, refine and try again – momentum beats perfection.
Get the scorecard into circulation, make it the opening page of every exec meeting, and watch how quickly clarity, accountability, and performance follow.
Build the habit, keep it simple, and let the numbers spark the right conversations. That’s how KPIs turn from charts on a slide into a real competitive advantage.